Check Framework Health
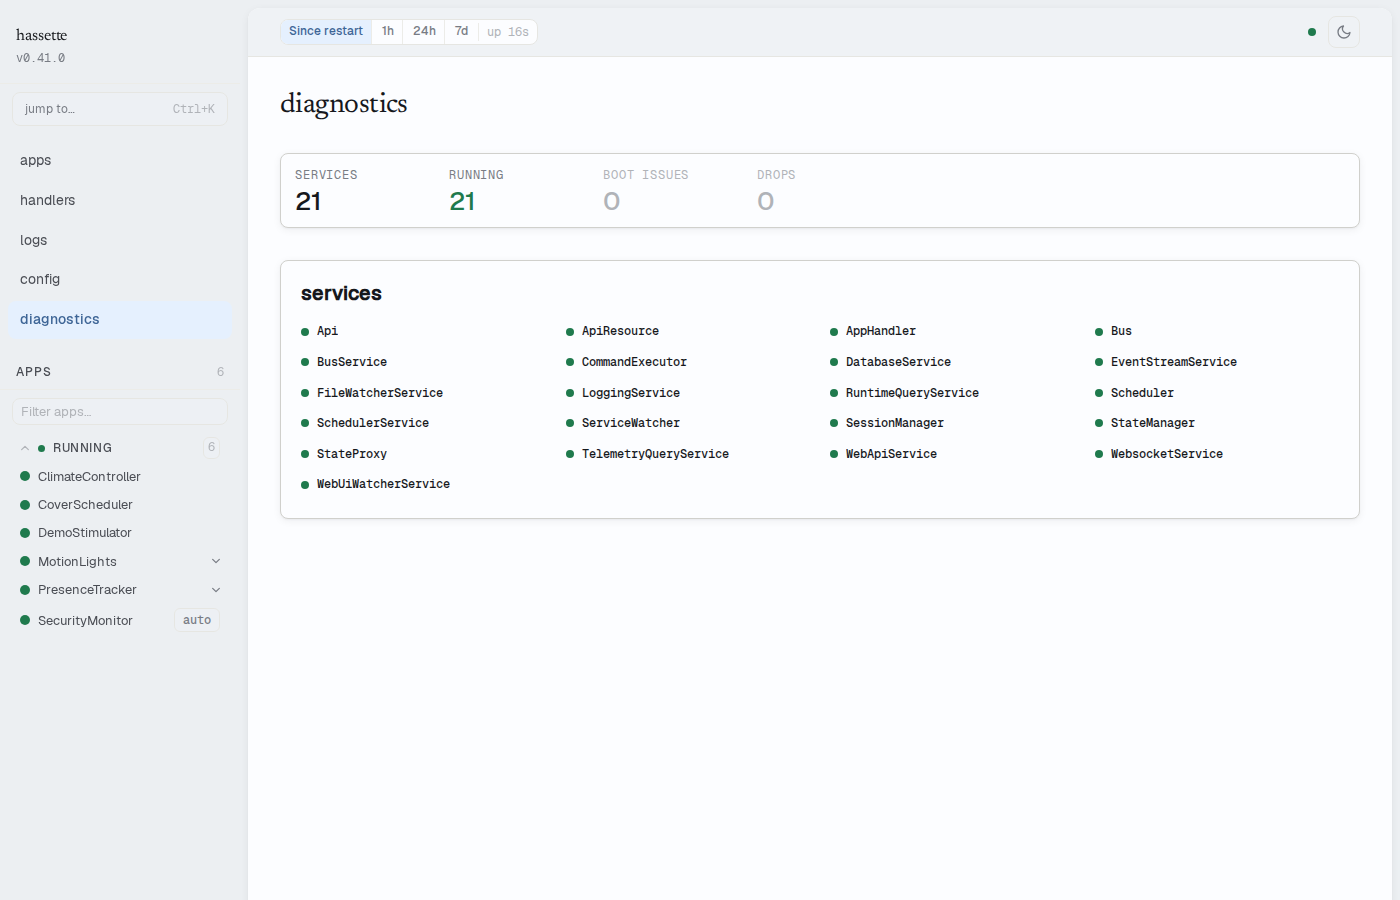
The Diagnostics page (sidebar > diagnostics) answers one question: is the framework itself healthy? It covers Hassette's internal services, startup issues, and telemetry pipeline health — the layer below your apps.
Stats strip
The strip at the top summarizes the page in four numbers:
| Cell | Meaning |
|---|---|
| services | Total internal services registered |
| running | Services currently in the running state — green when all are running, amber otherwise |
| boot issues | Problems detected during startup — red when non-zero |
| drops | Telemetry records dropped across all categories — amber when non-zero |
Services
The services panel lists every internal service (Bus, Scheduler, Api, DatabaseService, and the rest) as a compact grid. A healthy service shows only its name and a green dot — status text appears when there is something to say.
Services that are not running sort to the top and span the full row, showing their status, readiness phase, and — for a service in cooldown after repeated failures — when the supervisor will retry. A failed service with a captured exception gets a "show exception" toggle that expands the full traceback inline.
Service states update live over the WebSocket connection. When the connection drops, a
stale badge appears next to the panel heading and the data reflects the last known state.
Boot issues
The boot issues panel appears only when startup produced warnings or errors — a missing app directory, an app that failed to import, a config problem. Issues sort errors-first, each with a label and detail text. A clean startup renders no panel; the stats strip's zero is the confirmation.
Telemetry health
The telemetry panel appears when the telemetry pipeline is degraded or has dropped records. Drop counters are broken out by cause: buffer overflow, failed writes, drops during shutdown, and error-handler failures. A degraded banner means writes may be failing or the database is unavailable — some historical data may be missing.
Related pages
- Web UI Overview — layout, navigation, and alert banners
- Configure Health Checks — the REST endpoints behind this page